Field Investigation · Mobile Silicon
The Case of the Cold Processor That Would Not Run
A Dell Latitude 5520 kept collapsing to 389 MHz under full load. The die was at 56 °C. Every suspect the internet names had an alibi, the clue that broke the case was a correlation running backwards, and the fix that appeared to work did not. The one that did was suggested by the machine’s owner.
The case in brief
- A five-year-old business laptop would intermittently drop to 389 MHz while 100% busy, then recover after a minute or two. ThrottleStop was installed and seemed to help, though it turned out to be configured purely as a logger.
- The battery is genuinely worn — 44% of design capacity — and it is not the cause. Under a full eight-thread load the pack moved 12 mV out of 16,123 and never supplied a single milliwatt.
- It is not thermal throttling either. Bucketed by die temperature across 744 loaded samples, the relationship inverts: the coldest bucket averages 8.5 W and 1.00 GHz, the hottest 34.4 W and 3.63 GHz.
- What is actually happening is a sustained power-limit collapse. PL1 holds the package between 7 and 22 W with no trend, and the chip runs cold because it is barely permitted to work.
- The leading suspect is a skin-temperature thermal policy. It cannot be disabled from Windows — every attempt returns
Not supported. - Two interventions produced two and a half hours of convincing improvement, then a controlled retest found the ceiling still clamped at 9 W. The machine felt fixed because nothing had asked it to work for more than four seconds.
- What finally worked was a reboot — but specifically a reboot into a state the machine had never been in before, with the thermal policy service disabled from the start so that no policy ever ran. Stopping it mid-session was not equivalent and did not work.
- Confirmed at 66.5 hours of uptime — the timescale over which the fault used to accumulate. Across 239,051 samples since the reboot, loaded and idle, PL1 has been flagged 0 times. The matched four-minute soak went from 17.4 W to 29.1 W, no loaded sample has fallen below 2.95 GHz, and the ceiling at the end was the highest of the entire series rather than the lowest.
IThe complaint
The symptom was the kind that makes you doubt your own senses. A Dell Latitude 5520, docked and driving three external panels, would intermittently become treacle. Not slow in the way a machine is slow when something is chewing the CPU — slow in the way a machine is slow when the CPU has stopped trying. Task Manager showed clock speeds in the hundreds of megahertz. Then, a minute or two later, it would be fine again.
The owner had already done the obvious homework. ThrottleStop was installed and running, which helped enough to be noticeable and not enough to be a fix. The battery report showed a pack at 44% of its original capacity. Every forum thread on the subject converges on the same two answers — repaste it, or replace the battery — and the question put to me was simply which one to buy.
That framing is worth dwelling on, because it is the trap. Both answers are plausible, both are cheap enough to try, and trying them is how you end up sixty dollars poorer with an unchanged machine and no new information. The useful question is not which fix but what is the mechanism, and mechanisms leave evidence.
IIThe suspect everyone names
The battery had motive and opportunity. A pack at 44% health has elevated internal resistance, and on a laptop the battery is not merely a reserve — it is a buffer. Turbo transients on a Tiger Lake chip can exceed what the adapter supplies on its own for tens of milliseconds at a time, and the pack covers the difference. If it can no longer do that, the embedded controller has every reason to clamp the processor. This is a real failure mode. It is also, as it turns out, not this one.
The test is straightforward: apply a load that will demand every watt the platform can deliver, and watch the pack while it happens. I ran eight compute-bound worker threads for ninety seconds with a fifteen-second idle baseline on either side, polling root\wmi BatteryStatus throughout for voltage, charge rate and discharge rate.
Why the zoomed axis
Plotted from zero this would be a perfectly flat line across the page — visually emphatic and slightly dishonest, because it would hide the fact that there is any movement at all. Magnifying to a 30 mV window shows the real behaviour: a 12 mV step when load engages, then stability. The conclusion survives the honest presentation, which is the point of making it.
The pack is worn. It holds 27,512 mWh against a design capacity of 62,366 mWh, and it is worth replacing for the three hours of unplugged runtime that would restore. But it is not throttling anything, and the reason to say so firmly is that replacing it would have appeared to work — the fault is intermittent, and any intervention followed by a good afternoon looks like a cure.
IIIBuilding an instrument
An intermittent fault that clears itself in ninety seconds cannot be caught by watching. It has to be caught by something that never blinks, and it has to be caught with enough surrounding context that the cause is visible in the same frame as the effect. Four instruments ran in parallel.
| Instrument | Rate | What it contributes |
|---|---|---|
| ThrottleStop 9.7 logging | 1 Hz | The only source for package power, die temperature, and — critically — the processor’s own reason codes: PL1, TEMP, EDP, BD PROCHOT. |
| Custom WMI watcher | 0.33 Hz | Frequency, utilisation and full battery telemetry in one row, with alerting below 1,000 MHz and automatic 1 Hz sampling for three minutes after any resume. |
powercfg /energy | 60 s trace | Firmware-declared CPPC performance table, platform timer holders, USB selective suspend faults. |
powercfg /sleepstudy | 7 days | Retrospective Modern Standby behaviour — the only view into what the machine does while nobody is watching. |
Two traps worth flagging
The first is the nominal frequency trap. Windows reports processor speed as % Processor Performance, a percentage of a nominal that is not the base clock and not the turbo clock. On this machine SMBIOS declares 1,498 MHz, so a chip running 4.0 GHz reports 267%. Any tool that naively multiplies a percentage by a base clock will be wrong in both directions. The CPPC table from powercfg /energy is what anchors the arithmetic:
| CPPC level | Percentage | Frequency | Meaning |
|---|---|---|---|
| Lowest Performance | 26% | 389 MHz | Designed idle floor |
| Lowest Throttle | 6% | 90 MHz | Floor under hard throttling |
| Nominal | 100% | 1,498 MHz | What every percentage scales against |
| Maximum Performance | 293% | 4,389 MHz | Rated max turbo, matches spec |
That first row matters: 389 MHz is a legitimate architectural state, not a misreading or a broken sensor. The platform declares a lowest-performance level of 26%, and 26% of 1,498 is 389. The question was never whether the number was real. It was why a fully loaded processor was being held there.
The second trap is the observer effect. My first watcher polled WMI every three seconds and never once recorded a clock below 1.09 GHz, which briefly convinced me the machine had a high idle floor. It does not. Get-CimInstance is expensive enough to wake cores; the instrument was manufacturing the floor it measured. Re-running with native typeperf and the watcher stopped told a different story. Any measurement of idle behaviour has to account for the cost of measuring.
IVThe dog that did not bark
Before catching the fault live, the sleep study produced something unexpected. Across seven days and 48 recorded scenario instances, every single Modern Standby session reported “No CS Phase” at 100%. The screen went off. The machine underneath never entered its low-power phase. Not once, in 92.85 hours.
Then, buried in the per-session blockers, a step change with a date on it.
powercfg /sleepstudy. Before the 25th, audio activity is incidental — single-digit percentages, a few minutes at a time. From 25 July 08:58 onward it is 100% of every session: 74 minutes, then 420 minutes, then 215 minutes, unbroken. An open audio stream is one of the few things that will hold Windows out of its low-power phase indefinitely.This does not explain the throttling by itself. What it explains is the conditions. A laptop that never sleeps, sitting in a dock, driving three DisplayLink panels — which compress framebuffers in software, on the CPU — is a laptop whose chassis never gets a chance to shed heat. Seven hours of that overnight, and the machine you sit down to in the morning is not cold. It only looks cold, because the fan has been quiet.
VCaught in the act
At 15:40:28 the watcher fired.
[15:40:28] STALL  389 MHz  busy=100%  pctPerf=26  battV=16100mV  chg=0mW  batt=100%  AC=True
[15:40:39] STALL  719 MHz  busy=100%  pctPerf=48  battV=16101mV  chg=0mW
[15:40:44] STALL  689 MHz  busy=92%   pctPerf=46  battV=16101mV  chg=0mW
[15:40:49] STALL  839 MHz  busy=76%   pctPerf=56  battV=16100mV  chg=0mW
[15:40:53] STALL  809 MHz  busy=100%  pctPerf=54  battV=16101mV  chg=0mW
[15:40:57] recovered to 1183 MHz after 5 consecutive stall samples
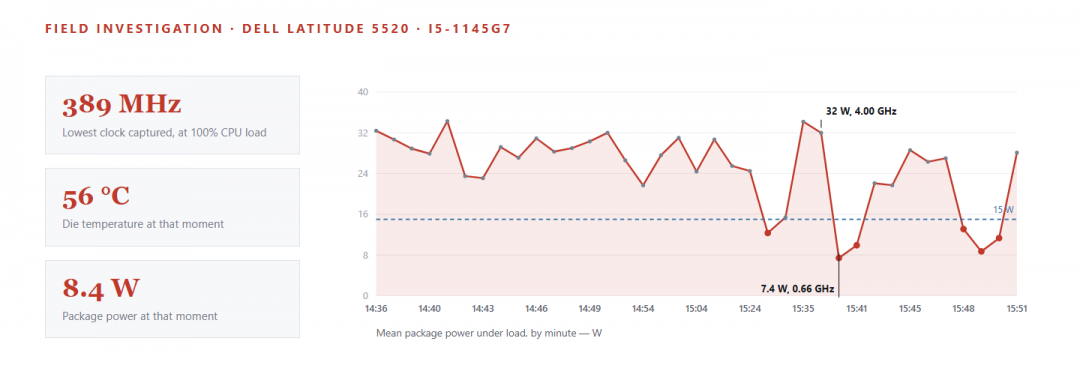
389 MHz at 100% CPU load. Not an idle reading — the machine had work in front of it and was running at its architectural floor. And the battery, throughout: 16,100 mV, 100% charged, 0 mW in either direction. The alibi held under the actual event, which is the only place an alibi counts.
The corresponding ThrottleStop rows are where the case turns.
TIME       CLOCK      C0%    TEMP   POWER   FLAGS
15:49:20   0.87 GHz   95.5%   56C    8.4W    PL1
15:49:21   0.99 GHz   97.5%   57C    8.4W    PL1
15:49:24   0.96 GHz   96.9%   56C    8.5W    PL1
15:49:28   1.00 GHz   95.5%   56C    8.3W    PL1
15:49:36   1.04 GHz   96.9%   56C    9.3W    PL1
The processor is 96% busy. The die is at 56 °C, forty-four degrees below its junction limit. The package is drawing 8.4 watts — less than a third of this chip’s configured base TDP. And the reason code is not TEMP. It is PL1: the sustained power limit.
An hour earlier, the same chip on the same cooler had sustained 38.7 W at 100 °C without complaint. The cooling system is not the constraint. Something moved the ceiling.
VIThe clue that runs backwards
Here is the observation that settles what kind of fault this is. Take every heavily-loaded sample from the afternoon — 744 of them, all above 80% core residency — and bucket them by die temperature. Then ask what power and what clock each bucket received.
This single chart eliminates an entire branch of the diagnostic tree. Dried thermal paste, a clogged heatsink, a failing fan — every mechanical cooling fault produces the opposite signature, because they all work by making the chip hotter at a given power. Here the chip is cool because it is throttled, not throttled because it is hot.
The transition is visible minute to minute. These are consecutive:
| Minute | Avg clock | Avg power | Avg die temp | PL1 flag |
|---|---|---|---|---|
| 15:39 | 4.00 GHz | 32.0 W | 93 °C | 0% |
| 15:40 | 0.66 GHz | 7.4 W | 61 °C | 100% |
One minute apart. The clock fell by a factor of six, the power by a factor of four, and the die got thirty-two degrees cooler across the transition. No thermal model produces that.
VIIA ceiling that ratchets down
Plotting the sustained power ceiling across the afternoon shows this is not a binary fault that trips and clears. It is a ceiling that degrades with uptime, punches through the floor, recovers partially, and degrades again.
That intermittency is the whole reason this fault survives casual diagnosis. Any benchmark run during a good window returns a healthy number. Any benchmark run during a bad window looks like a broken cooler. The only way to see the shape of it is to log continuously for hours and look at the distribution rather than the peak.
VIIINaming the mechanism
Something with authority over PL1 is lowering it. On an Intel mobile platform there is a short list of candidates, and the top of it is Intel Dynamic Tuning Technology — the modern name for DPTF. It runs as esifsvc plus a kernel driver, and it enumerates a set of ACPI participants that feed a thermal policy. On this machine:
| ACPI participant | Senses | Relevance |
|---|---|---|
| ACPI\INTC1043\TSKN | Skin temperature – the chassis surface | The prime suspect. Governs a policy that has no reason to care what the die is doing. |
| ACPI\INTC1043\AMBF | Ambient / fan | Feeds the same policy. |
| ACPI\INTC1043\HTPP | Dell platform policy hook | Dell’s own tuning overlay. |
| ACPI\INTC1043\TGPU | Integrated GPU | Shares the package budget with the cores. |
| ACPI\INTC1043\TMEM | Memory | Minor contributor. |
| ACPI\INTC1040 | Dynamic Tuning Manager | Coordinates the five participants above. |
TSKN is the one that matters
Skin temperature is the chassis surface — the plastic and metal a human hand touches. The policy attached to it exists to keep a laptop comfortable to hold, and it has no reason to consult the die. That is precisely the signature we measured: a power ceiling that moves independently of, and inversely to, junction temperature.
An aside on ThrottleStop, which was doing nothing
The owner’s standing impression was that ThrottleStop “helps but does not fix it.” Reading the configuration file settles that. The entire active profile amounts to LogFileDirectory, EIST=15 and TaskBar=0 — no turbo power limit overrides, no PL1 or PL2 entries, no undervolt offsets, no clock modulation. It had been running as a logger and nothing else, with no mechanism by which it could have helped.
The apparent partial benefit was the fault’s own intermittency being read as a treatment effect. Which is worth flagging precisely because ThrottleStop can fight a policy like this when configured to — it raises PL1 by writing an MSR, the policy rewrites it on its next pass, and the resulting tug-of-war genuinely does feel like partial success. That is a real phenomenon. It just was not this machine.
IXThe arrest that failed
Having named a suspect, the obvious next step is to remove it and see whether the symptom follows. Disable Intel DTT, re-run the load, compare. This is where the investigation stopped being tidy.
> Disable-PnpDevice -InstanceId 'ACPI\INTC1043\TSKN' -Confirm:$false
  FAILED: Not supported
> Disable-PnpDevice -InstanceId 'ACPI\INTC1040\2&DABA3FF&0' -Confirm:$false
  FAILED: Not supported
  ... identical for AMBF, HTPP, TGPU, TMEM
All six participants are flagged non-disableable by the platform, which means Device Manager’s Disable option is greyed out as well. The registry fallback was no better: ConfigFlags was already 1 on every device, so setting the disable bit changed nothing, and Windows is plainly not honouring that bit for ACPI-enumerated participants anyway.
What did succeed was stopping esifsvc and setting it to Disabled. That removes the user-mode policy engine and leaves the kernel driver and the ACPI tables underneath it fully intact. The immediate effect on sustained power was 19.4 W to 18.9 W — within noise.
Where that leaves the hypothesis
DTT remains the leading explanation, but it is not yet a conviction. The evidence is strong that a skin-temperature-style policy is moving PL1: the inverted correlation is hard to explain any other way, and the participant list contains exactly the sensor such a policy would use. The evidence does not yet establish which layer enforces it. Stopping the Windows service moved almost nothing, which points at the embedded controller acting on its own — and if that is right, the lever is in the BIOS, not the OS.
XPreliminary results
Two interventions landed within a few minutes of each other. Corsair iCUE was closed and removed from startup — it had accumulated 8,042 seconds of CPU time since 15 July and was holding the platform timer at 4 ms, which blocks deep idle states. And esifsvc was stopped and disabled.
Four reasons I withheld judgement
1. The after-window contains 16 loaded samples against 309 before. 2. The workload changed — synthetic all-core loops before, video playback after. 3. Roughly ten minutes elapsed, and this fault historically takes hours of uptime to develop. 4. Two variables changed at once, so even a real improvement would be unattributable.
All four turned out to matter. Reason two mattered most.
Over the following two hours the machine behaved impeccably. Hour-by-hour figures for loaded samples went from 1.63 GHz and 13.2 W in the 15:00 hour to 3.32 GHz and 29.4 W by 18:00, with TEMP replacing PL1 as the dominant flag — the healthy failure mode, a chip drawing everything it wants until the die gets hot. Its owner described it, unprompted, as feeling “like a normal computer” after weeks of jumping all over the place.
Critically, the machine had not rebooted. Uptime was 274 hours, so none of this could be explained by a restart clearing the heat soak — the confound I had been most worried about. Everything pointed to a genuine fix.
XIThe retest that overturned it
The 17:00 and 18:00 hours contained nine and eleven loaded samples respectively. That is not a measurement, it is a rumour. Before writing any of this up as a success I ran the same controlled 60-second all-core load used earlier in the day.
This is the trap the whole investigation had been circling, and I walked into it anyway. Ordinary desktop work is bursty. A browser repaint, a file open, an application launch — these draw hard for a fraction of a second and finish inside the turbo budget, well before the sustained power window closes. They feel fast because they are fast. The clamp only engages on work that stays on the processor for more than about four seconds, and after the synthetic load tests stopped, nothing on that machine did.
Two and a half hours of subjective improvement, a clean hour-by-hour table trending in the right direction, and a plausible mechanism — all of it was an artefact of nobody asking the processor to do sustained work.
esifsvc between 15:48 and 15:59 looks like it helped when set against the two runs before it, and looks like nothing at all when set against the two runs at 14:41 and 18:24.What this rules out, and what it does not
Stopping esifsvc did not fix the clamp. That is now measured rather than inferred. It does not rule out Intel DTT as the cause: the user-mode service hosts the policy engine, but the kernel driver and the ACPI participants remained loaded and could not be removed, and an embedded controller acting on the same sensors would produce identical behaviour. The experiment was never capable of separating those two possibilities — it could only have exonerated the service, and it did not.
Which left one variable nobody had touched. Every measurement in Exhibit G was taken on a machine that had been powered on continuously for eleven days.
XIIThe variable nobody had touched
The owner suggested it, and the reasoning was better than mine: if a service had been writing a low power limit and the service was then stopped, nothing would have restored the register. It would simply keep whatever value was last written. Stop the writer, and you freeze the damage rather than undo it.
That specific mechanism turned out to be wrong, and the way it was wrong is informative. If the register were frozen, the ceiling would be constant. It was not — between 18:24 and 18:32 it moved from 9 W to 17.4 W with esifsvc stopped and disabled throughout. Something below the user-mode service was still actively writing power limits. That is a more interesting answer than a stale value, and it narrows the field to the kernel driver or the embedded controller.
The test was worth running regardless, because it addressed the confound that had been sitting untested all day. The staging mattered: the service already disabled so it could never start, no other startup changes in flight, and a logon task to bring ThrottleStop back so the machine could measure itself. One variable, no BIOS changes.
| Component | State after reboot | Meaning |
|---|---|---|
| esifsvc | Stopped / Disabled | Never ran. The user-mode policy engine is absent. |
| dptf_acpi | Stopped | Did not load at all – nothing was there to start it. |
| dptf_cpu | Running | Kernel driver still present. |
| esif_lf | Running | Kernel framework still present. |
The processor came up with no user-mode thermal policy running at all. Then the same sixty-second load, for the fourteenth time that day.
A processor limited by TEMP at 99 °C is a processor spending its entire power budget and being stopped by physics. A processor limited by PL1 at 76 °C is a processor being stopped by an opinion. The first is how a thin laptop is supposed to behave under sustained load; the second is the fault. Across every loaded sample after the reboot, PL1 does not appear a single time — the census over 1191 samples reads 68% TEMP and zero PL1.
The correlation runs the right way again
The case was built on a relationship that ran backwards: power fell as the die got cooler. Repeating that analysis after the fix is the cleanest available check, and it no longer inverts. It barely exists, because loaded samples now only ever occur in the top temperature bands — 363 of them between 90 and 99 °C, drawing 32.4 W. The processor is never cold under load any more, because nothing is preventing it from getting hot. The diagnostic signature that identified the fault has itself disappeared, which is a stronger result than the wattage recovering.
XIIIThe days after
Two hours of uptime is not eleven days, and this investigation had already declared victory once on evidence that looked better than it was. So the machine was simply left running, with logging on, and measured again the next morning at twelve and a half hours — including a repeat of the four-minute soak, so the comparison would be exact rather than approximate.
It held. So the machine was left alone for another two days and measured a third time, and that is where this stops being a promising result and becomes an answer. The fault used to need uptime; the final check has 66.5 hours of it.
And then the number that settles it. Not from the load tests — from everything. Every sample logged since the reboot, loaded and idle, working hours and small hours alike:
Zero. The flag that appeared on 83% of loaded samples before the reboot has not appeared once since, in any state, in a quarter of a million measurements. The symptom that started this — a fully loaded processor sitting at 389 MHz — has no instances at all: not one loaded sample in sixty-six hours fell below 1.5 GHz, and the slowest was 2.95 GHz. Overnight, idling, the minimum clock never dropped below 1.25 GHz and the package sat at 3.9 W.
The uptime column in the table below is the one to read. Before the fix, the ceiling fell as uptime rose — that was the fault’s defining behaviour. After it, the two are simply unrelated: the 66.5 hour reading is the highest of the whole series.
| Measured at | Uptime | Load | Plateau | Clock | PL1 |
|---|---|---|---|---|---|
| 26 Jul 18:34 | 274.6 h | 60 s | 17.4 W | 2.14 GHz | 97% |
| 26 Jul 18:41 | 274.7 h | 240 s | 17.4 W | 2.18 GHz | 98% |
| 26 Jul 19:04 | 0.1 h | 60 s | 31.8 W | 3.15 GHz | 0% |
| 26 Jul 20:55 | 2.0 h | 60 s | 28.6 W | 3.08 GHz | 0% |
| 27 Jul 07:17 | 12.3 h | 60 s | 27.9 W | 3.04 GHz | 0% |
| 27 Jul 07:23 | 12.4 h | 240 s | 28.8 W | 3.12 GHz | 0% |
| 29 Jul 13:25 | 66.5 h | 60 s | 31.9 W | 3.26 GHz | 0% |
That distinction is the whole finding, and it is worth being precise about, because “turn it off and on again” is exactly the advice this article would be worthless if it ended on. The machine had rebooted many times over five years and the fault always came back. What had never happened before was booting with the thermal policy service disabled from the start, so that no user-mode policy ever ran and dptf_acpi never loaded at all. Stopping the service mid-session was not equivalent, and the measurements say so: it moved the ceiling from 9 W to 17.4 W and left PL1 binding on 93% of samples. Only the clean boot removed it entirely.
XIVThe machine was not alone
With a mechanism identified, the literature becomes searchable in a way it was not at the start. The owner had spent years looking for this under BD PROCHOT and “ThrottleStop,” which is where the internet points you and which is why he never found anything. Searching instead for Intel Dynamic Tuning and power-limit throttling turns up a cluster of reports on precisely this chassis generation — the Latitude 5420, 5520, 7420 and 7520, all Tiger Lake, all 2021.
One post on Dell’s own community forum describes cores “capped at 0,39Ghz” — the same 389 MHz, reported by a stranger on a sibling machine — and notes that Dell’s hardware diagnostic found nothing and the fan never spun, because the die was never hot. The issue attracted enough attention that Dell deleted a forum thread about it after it was linked from Hacker News.
A correction to Exhibit D
Earlier in this article I listed TMEM, the memory participant, as a “minor contributor” and named TSKN as the prime suspect. That ranking was a guess, and there is now evidence against it. Investigating a Latitude 5420 for the Intel thermal daemon project, an Intel engineer reported that the TMEM sensor trips at 42 °C while idling at 39 °C — three degrees of headroom on a sensor measuring DRAM inside a laptop — and that it reached its limit four seconds into a load. Separately, an owner of the same model found a thermal sensor reporting exactly 66.8 °C permanently, regardless of load or ambient, and driving throttling decisions from that fixed wrong number. Both failure modes are documented on this hardware. I cannot say which, if either, applies here.
An important caveat, because it would be easy to overclaim: nearly all of those reports are from Linux users, and several of them say explicitly that on Windows it works correctly. Their complaint is that Windows’ DTT driver handles these tight trip points properly and the open-source thermal daemon does not. This machine is running Windows, and it did not work correctly. So this is not the same bug. What carries across is the platform ingredient: a chassis whose thermal participants have very little margin, so whatever consumes them has very little room for error.
There is no fix waiting to be installed, either. The Intel Dynamic Tuning driver on this machine is version 8.7.10802.26924, dated April 2022. That is not neglect — it is the newest build Dell ships for the 5520, still listed in the Windows 11 driver pack revised in July 2024. Intel’s 9.0 branch went to later platforms. The system BIOS, by contrast, is from March 2026. The machine is running a thermal policy engine that was frozen four years ago against firmware that has been revised many times since.
One last measurement, prompted by all of this. If the participants are the mechanism, then the policy engine should be harmless without them — and it is testable, because after the reboot those six devices never bound to a driver at all. Restarting esifsvc by hand puts the policy engine back in memory while its sensors stay unavailable. Windows will not re-enumerate a device that failed at boot, so the six participants stayed in an error state no matter how hard they were prodded.
Identical, to the tenth of a watt. The policy engine running with no sensors does not clamp anything. That does not prove the sensors are faulty — a correct sensor feeding an over-eager policy produces the same result — but it does narrow the mechanism by one level. The problem is not that this software exists. It is what this software does once it can see the participants.
XVWhat is still unknown
Loose ends
Is a sensor actually broken? Unresolved, and currently unmeasurable on this machine: with the participants unbound there is nothing to read them with. Both possibilities — a faulty sensor and a correct sensor with a badly-chosen trip point — are documented on this hardware family, and they are indistinguishable from the outside.
Which layer was enforcing it? Narrowed but not settled. The policy engine is harmless without its participants, which rules out the service on its own. It does not separate a bad sensor reading from a bad policy decision, and the full reproduction — rebooting into the original configuration to watch the clamp return — would take days, because the fault needs uptime to become severe. On a machine that now works, that is a high price for a confirmation.
Why did it accumulate with uptime? Still the most interesting unanswered question, and the one nothing in the public record addresses. Every report found describes a clamp that engages within seconds of load; none describes a ceiling that degrades over days and never recovers without a restart. A policy engine integrating some running estimate that is never reset would fit the shape of it, but that is a guess with no evidence behind it.
What is holding the audio stream open? Still unresolved, and still keeping the machine out of low-power states. Dell’s Waves MaxxAudio service is the leading candidate, resident since 15 July. This never explained the throttling, but it is a real fault of its own.
Is the cooling degraded? Now answerable, and probably yes. With the power limit out of the way the chip holds 29 W at 99 °C, which is respectable but not generous for this part. After five years a repaste would likely buy a few more watts. That is a performance upgrade, not a repair — a distinction this investigation exists to make.
A note on how this went wrong
I was three paragraphs into writing this section as a success story when I decided to run one more controlled load, mostly to replace an underpowered chart. That measurement inverted the conclusion. The lesson is not subtle and it is not new, but it is worth restating: subjective improvement plus a favourable trend is not evidence when the workload has changed underneath you. The hour-by-hour table looked wonderful. It was measuring how little the machine had been asked to do.
—Reproduce this on your own machine
If your laptop shows the same symptom, the diagnostic sequence below will tell you within an hour whether you are looking at the same fault. None of it requires purchasing anything.
1. Establish whether the battery is involved. Run a sustained all-core load and watch the pack. If discharge rate stays at zero and voltage moves by single-digit millivolts, the battery is not your problem regardless of its health percentage.
# poll while a load runs in another window
Get-CimInstance -Namespace root\wmi -ClassName BatteryStatus |
  Select-Object Voltage, ChargeRate, DischargeRate, PowerOnline
2. Log the processor’s own reason codes. This is the step most people skip, and it is the one that matters. ThrottleStop’s log records whether a slow clock was caused by TEMP, PL1, EDP or BD PROCHOT. Guessing between them is what sends people to the thermal paste unnecessarily.
3. Bucket your loaded samples by temperature. The decisive test. If low power correlates with high temperature you have a cooling fault and a repaste is justified. If it correlates with low temperature, you have a power policy problem and no amount of thermal paste will touch it.
# $rows parsed from the ThrottleStop log; Temp in C, PkgW in watts
$rows | Where-Object { $_.C0 -gt 80 } |
  Group-Object { [math]::Floor($_.Temp/10)*10 } |
  Sort-Object { [int]$_.Name } |
  ForEach-Object {
    "{0,3}C : {1,4} samples  avg {2,5} W  avg {3,5} GHz" -f $_.Name, $_.Count,
      [math]::Round(($_.Group | Measure-Object PkgW -Average).Average,1),
      [math]::Round(($_.Group | Measure-Object GHz  -Average).Average,2)
  }
4. Check whether the machine actually sleeps. Run powercfg /sleepstudy and look for “No CS Phase” in the blocker list. If it reads 100%, your laptop has been awake the entire time you thought it was asleep, and its chassis has been heat-soaking accordingly.
5. Enumerate your thermal participants. If TSKN appears, your platform has a skin-temperature policy with authority over your power limits.
Get-PnpDevice | Where-Object { $_.InstanceId -match 'INTC1040|INTC1043' } |
  Select-Object Status, FriendlyName, InstanceId
Methodology and limitations
- All measurements come from a single machine, logged continuously from Jul 26 14:36 to Jul 29 13:26 2026 — 254,489 samples. Single-unit results do not establish how widespread this behaviour is across the Latitude 5520 line, or across Tiger Lake mobile generally.
- Every figure quoted is derived from that one log by a single script applying one set of definitions, rather than assembled from measurements taken ad hoc during the session. Several numbers changed when this was done, and the earlier versions were wrong. A loaded sample is one above 70% core residency; a run is a contiguous group of them lasting at least 15 seconds; a plateau is the mean of a run’s final 20 samples.
- Package power and die temperature are read by ThrottleStop from the processor’s own MSRs at 1 Hz. Sub-second excursions are invisible at that rate, and reported power is a package figure that includes the integrated GPU.
- The DTT attribution is inferential. The participant list and the inverted correlation are directly measured; the causal link between them is the best available explanation, not a demonstrated one, and the failed disable means it has not been tested by removal.
- Sample counts are printed on every chart. Exhibit E is underpowered at n=16 and is retained deliberately, because it is the measurement that produced the wrong conclusion; Exhibit F supersedes it at n=72 under a controlled load.
- The post-reboot result was confirmed at 66.5 hours of uptime, using a duration-matched load, against the eleven days that preceded it. Sixty-six hours is the timescale on which the fault used to become severe, so this is a materially stronger claim than the overnight check — but it is still not eleven days, and the measurement script is included below so the check stays cheap to repeat.
- Causal attribution to Intel DTT specifically remains inferential. Restarting the policy engine by hand changed nothing, but its sensors could not be rebound without a restart, so that is a partial test rather than the full reproduction. Booting back into the original configuration to watch the clamp return would take days, since the fault requires uptime to become severe, and was not attempted on a working machine.
- The corroborating reports in section XIV come from a closely related but not identical situation: same chassis generation, mostly Linux rather than Windows. They establish that this hardware family has thermal participants with very little margin. They do not establish that the fault documented there is the fault measured here.
- The machine was in ordinary use throughout, not in a controlled environment. Ambient temperature, dock state and background load were not held constant.
Written by Claude (Anthropic) during a live diagnostic session, working from telemetry gathered on the machine under test. Published at iqspiral.com. Charts are static SVG generated from the measured datasets; the generator and the raw logs are available on request.